- Telephone
- Email

There is no doubt that the national housing market is in a major downturn phase.
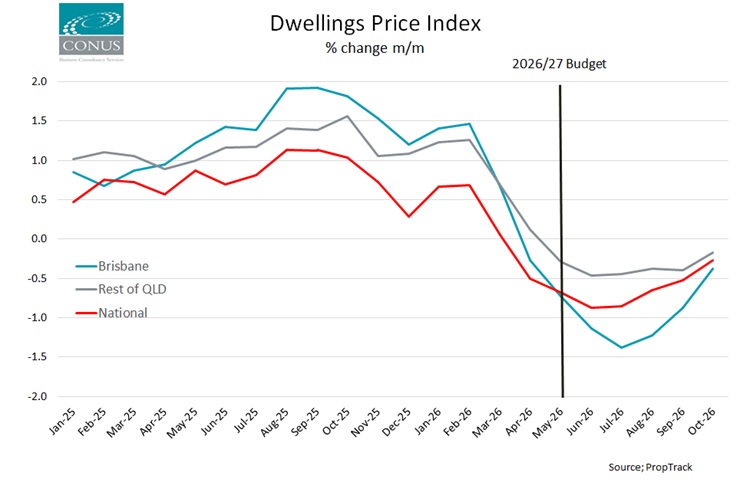
While much of the blame, at least initially , was laid at the feet of the tax changes announced in the May Federal Budget (we have written a few posts about this, see here, here, here and here) it is clear that the decline in the major Sydney and Melbourne markets started well before the Budget announcements driven primarily by the start of the interest rate hiking cycle. National monthly price increase rates, which peaked above 1%/month in the third quarter of 2025, had turned negative by March 2026 and in Melbourne and Sydney as early as the end of 2025.
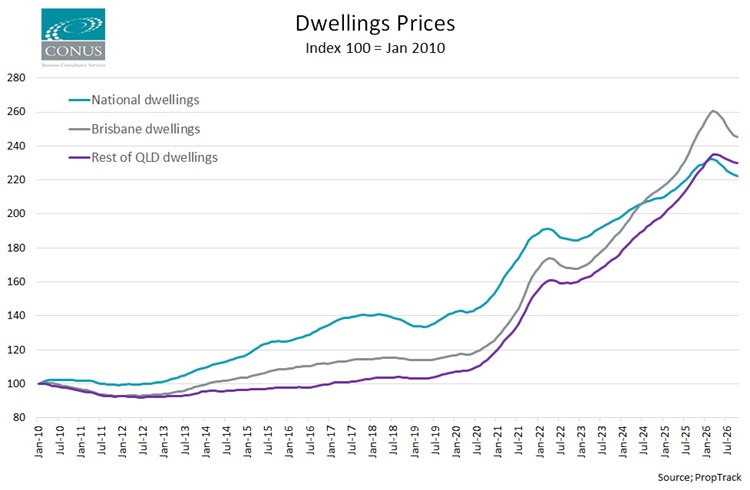
As interest rates have climbed and sentiment within the market has soured prices have continued to decline. Although, as the chart below makes clear, the decline needs to be seen in the context of the exceptional rise in prices witnessed in recent years. National dwelling prices have fallen 4.3% from their March 2026 peak; compare this with the 14.8% increase in the two years to March 2026! National dwellings prices are back to levels last seen as recently as August 2025.
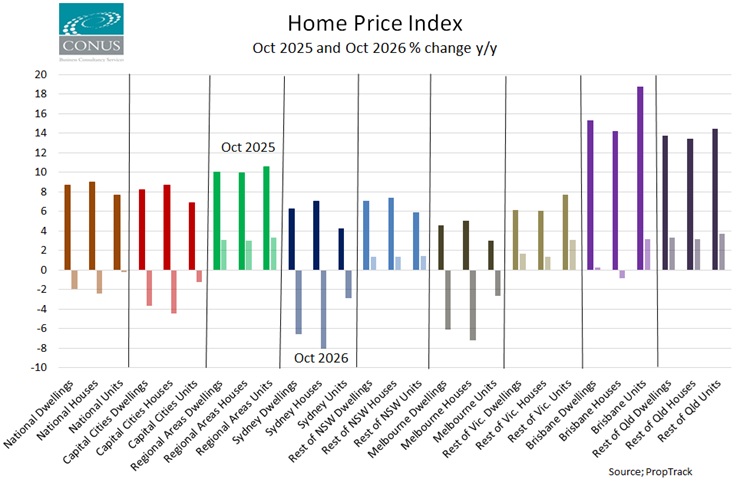
The declines have been extremely varied across the nation. The chart below shows how the year-on-year pace of change has altered between Oct 2025 and Oct 2026. While nationally dwellings have shifted from growing at almost 9% y/y to now declining at 2% y/y the story is very different when we consider regions other than Melbourne and Sydney. Regional dwellings, which were growing at 10% y/y are still growing now at 3% y/y. Regional Queensland has been particularly robust to the downturn with dwellings still up more than 3% y/y and units up almost 4% y/y. Brisbane has not quite turned negative with units still up more than 3%.
Housing is still grappling with the interest rate hikes working their way through the market, and this data to October does not take into account the most recent November hike in the Cash Rate to 4.85%. However, the story is far from an uniform one. The futures market is suggesting that we are likely at, or very near to, the peak in rates with a 50:50 chance that the Cash Rate could be 25 bps lower by the end of next year. If the interest rate hiking cycle is indeed close to an end we may see those areas that have to date resisted the worst of the housing price falls only experiencing modest declines from here.
In Cairns the most recent sales data suggests that house price year-on-year increases have almost evaporated in the past couple of months while units have also slowed substantially and are now up just 4-5% on the year. We will not be surprised to see prices ease further in coming months but declines are likely to remain modest with continued supply constraints, relatively affordable prices (despite years of very solid growth), and an interest rate cycle that may be peaking.
All price data used in the post was from PropTrack.
 We are proud to have CBC Staff Selection as supporters of the Conus/CBC Staff Selection Trend Employment and Jobseeker data series