- Telephone
- Email

A month ago we argued that the fall in dwelling prices since March had rather less to do with the Budget’s negative gearing and CGT changes than the commentary suggested, and rather more to do with three interest rate rises (see here). The August PropTrack data (along with its revisions to previous months) is now out and it shows that some of what we said has held up well. One part of it has not, and we need to acknowledge that.
What held up
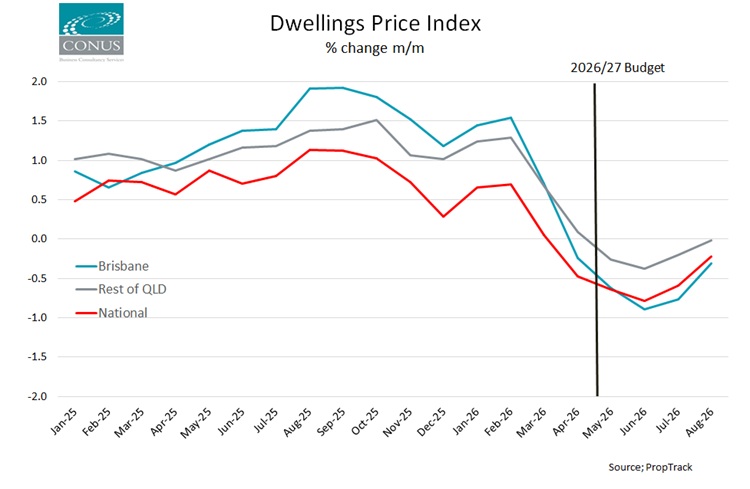
Our central claim was about timing. Prices peaked in March and first fell in April, before Budget night on 12 May, so a decline that was already underway could not have been caused by a policy that did not yet exist. Nothing in the August data disturbs that. April remains the first negative month, and on revised figures it is a slightly deeper one than we reported.
We also made a prediction, which is riskier than an observation, and it is the one part of the post we would happily run again. We wrote that if the tax changes were the primary driver, you would expect the effect to build rather than fade. Here is the sequence as it now stands:
|
Month |
Change |
|
April 2026 |
-0.47% |
|
May 2026 |
-0.64% |
| June 2026 |
-0.78% |
| July 2026 |
-0.59% |
| August 2026 |
-0.22% |
The deepest month of this downturn was June. Since then the falls have got shallower each month, and August was the mildest of the five. That is the wrong shape for a tax story. The 1 July 2027 start date is three months closer than it was in June, so if investors were repricing established stock in anticipation, the pressure should be increasing.
What we got wrong
Last month we said Brisbane was barely scratched, at 1.3% below its peak against a national 1.8%. On the current data Brisbane in July was 2.5% below peak, not 1.3%, and it is now 2.8% below peak against a national 2.7%. Brisbane is no longer outperforming on that measure at all. It is line ball with the national figure, and we were reporting a gap that has since been revised away.
We also said regional Queensland units set a new record high in July. They did on the data available at the time but on the revised series their peak was in April, and July was 0.5% below it. Our original post noted that the PropTrack index is revisionary, and how the whole ‘blame the Budget’ narrative had been built on an earlier vintage of the data that no longer existed. Our post of a month ago has been caught by exactly the same mechanism.
Every headline figure in that post has since been revised downward. Not one moved the other way:
|
July 2026 figure |
As we published it | Current version |
|
National, below peak |
-1.8% | -2.5% |
|
Brisbane, below peak |
-1.3% | -2.5% |
| Rest of Qld, below peak | -0.3% |
-0.8% |
|
Capital cities, below peak |
-2.5% |
-3.3% |
| National, annual growth | +3.9% |
+3.2% |
| Brisbane, annual growth | +11.1% |
+9.9% |
What has strengthened
The part of the argument that has grown considerably stronger is the divergence between capital cities and the regions, and it is now the clearest thing in the data.
Over the past 12 months the combined capital cities have managed +0.2%. Regional Australia is up 6.6%. In August the capitals fell 0.3% while regional Australia was unchanged, and regional markets sit just 0.5% below their peak against 3.6% for the capitals. 15 PropTrack series set fresh record highs in August; Darwin houses and dwellings, Hobart units, regional NSW units, regional NT (all series), regional SA (all series), regional Tasmania dwellings and houses, regional Victoria units, and regional WA dwellings and houses. This is far from being a universal decline.
Queensland remains on the right side of that line on the annual comparison. Brisbane is running at +7.5% over the year and Rest of Queensland at +7.7%, against +1.8% nationally and +0.2% across the capitals. Rest of Queensland was flat in August and is less than 1% below its April peak.
Units also continue to outperform houses, with houses 2.9% below peak and units 1.8%. The gap has narrowed but not closed, and it still points away from a tax story: units are the more investor-exposed segment, and if an investor tax shock were doing the work, that is where the damage should be concentrated.
Meanwhile, the rates story got louder
The RBA held at 4.35% on 11 August in an unanimous decision, noting that property prices had declined by a little more than anticipated. Since then the July CPI showed headline inflation easing to 3.5%, but the Trimmed Mean stuck at 3.6%, still well above the target band.
Markets are now pricing roughly a 66% chance of a fourth rate hike at the 29 September meeting. If that hike lands, it will tell us more about the direction of dwelling prices over the coming six months than anything in the tax legislation, which does not take effect until 1 July 2027.
The case against us
In fairness, one number has moved in favour of the Budget explanation, and it is the strongest evidence anyone has produced: investor loan commitments fell 8.6% over the June quarter. That is investor behaviour changing, in the right direction for the tax story, on roughly the right timescale, and it is not easily explained away.
The honest position is that the tax changes are contributing at the margin and will contribute more as July 2027 approaches. What we do not accept is that they explain a downturn that began before Budget night, that has been fading for two months, and that has left the highest-taxed low-yielding capital in the country, Brisbane, growing at 7.5% a year.
So what?
National prices are 2.7% below their peak and still 1.8% higher than a year ago. Regional Australia is half a percent below peak and up 6.6%. This remains a market coming off the boil rather than one in any distress.
Watch three things over the next month. The 29 September RBA decision, which matters far more than the Budget for anything happening before 2027. Whether regional Australia’s flat August turns into a run of flat months or resumes falling. And the widening gap between the two major indices: Cotality has August at -0.9% nationally against PropTrack’s -0.2%, and Sydney 7.1% below peak against PropTrack’s 4.9%. They now agree on direction in every capital and disagree sharply on speed. One of them is going to be revised toward the other.
 We are proud to have CBC Staff Selection as supporters of the Conus/CBC Staff Selection Trend Employment and Jobseeker data series