- Telephone
- Email

Back in August we wrote a post claiming that it made no sense to blame all of the property prices declines (that were obvious at the time) on the 2026/27 Budget and the tax changes included in it. A month later we wrote again, following the release of more data showing further falls, to see if our contention still made sense (it did).
And now, here we are another month on with another month of data to digest. So, have things changed to make us change our view? Spoiler alert; no, they have not.
Having said that, our view has had to be nuanced and certain details have shifted over the past 2 months.
We said in August that if the tax changes were driving this, the falls should deepen as the 1 July 2027 start date approached. Here is the full sequence on current PropTrack m/m figures for national dwellings:
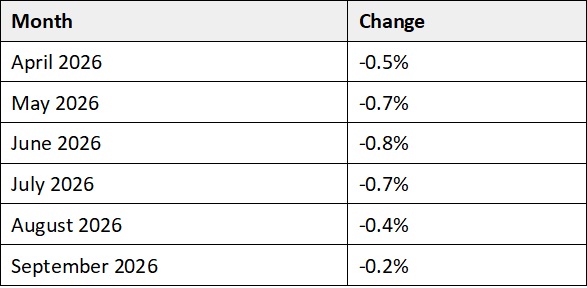
Six consecutive monthly falls, and the deepest of them was June. The falls have got shallower in each of the three months since, and September at -0.2% was the mildest of the lot. That is not the shape of a market repricing in anticipation of a tax change. It is the shape of a market absorbing a rate shock and then settling.
And then the RBA hiked again
On 29 September the Reserve Bank lifted the cash rate by 25 bps to 4.60%, its fourth increase of 2026 and the highest cash rate in almost 15 years. The vote was unanimous.
The Board dropped its August description of policy as ‘somewhat restrictive’, said a further tightening in financial conditions was warranted, and softened the condition on the next move from ‘if upside risks materialise’ to simply ‘if needed’. That is a lower bar, set at the same meeting the Board cleared the previous one.
The timing matters for reading the September housing data. The hike landed on 29 September, one day before the index closed. None of it is in these numbers. Whatever shows up in the October and November prints will be the market digesting a fourth rate rise, not a tax change that takes effect in nine months’ time. If you want a clean test of the rates-versus-Budget question, the next two releases are it.
The most recent data
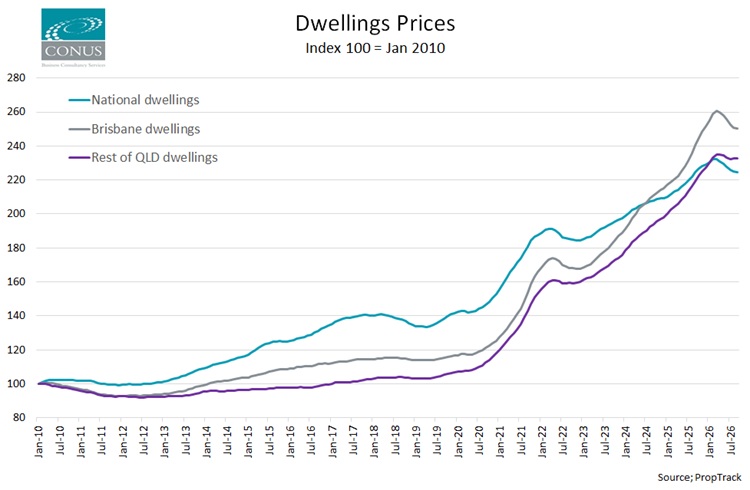
In August we wrote that Brisbane was barely scratched. In September we corrected that, noting Brisbane had pulled level with the national figure. This month it has gone past it.
On current figures (we are using the PropTrack Sept data throughout this post) Brisbane’s worst month was July, at -1.1%, and the city is now 3.9% below peak against a national 3.3%. Cotality, which runs hotter than PropTrack throughout, recorded Brisbane as the sharpest capital city fall in September at -1.5%, ahead of Sydney. The former growth leaders, Brisbane, Adelaide and Perth, are now among the sharpest decliners. Brisbane is no longer an exception to the national downturn. It is participating in it, and on the drawdown measure it is doing slightly worse than average. We said otherwise twice, and although that was true when it wrote it, it is no longer.
In fairness, this cuts toward the case that places an oversized blame (imho) on the Budget . Brisbane is the second-lowest-yielding capital in the country at 3.3% gross, behind only Sydney, and low yields are exactly where negative gearing should bite hardest. A tax story predicts Brisbane suffering.
Against that, Adelaide recorded the largest capital city fall in September at -0.6% and is 2.5% below its May peak, and Perth fell 0.3%. Both are higher-yielding markets where the negative gearing channel should be weakest. In our view the pattern across Brisbane, Adelaide and Perth looks less like a yield gradient and more like the three markets that ran hardest through 2025 giving back the most, which is what usually happens when borrowing capacity contracts.
What does still hold from our previous posts is the split between capitals and regions. Regional prices were unchanged in September, are just 0.7% below peak and remain 5.1% higher over the year, against capital city prices 1.6% lower than a year ago. Rest of Queensland has now been flat for two consecutive months, sits 1.1% below its April peak and is up 6.0% annually. The resilience is real; it is simply regional rather than Queensland-specific.
Both previous posts conceded that the strongest number supporting the Budget explanation was the 8.6% fall in investor loan commitments over the June quarter. We described it as investor behaviour changing on roughly the right timescale. However, we should have looked at the quarter before. Investor loan commitments fell 5.3% in the March quarter, which closed six weeks before Budget night. The investor retreat was already well underway before the policy existed, exactly like the price falls themselves. The June quarter accelerated a decline that had already started.
There is a second detail worth being aware of. New-build investor lending set a record in the June quarter, through the carve-out that exempts new construction from both measures. If investors were responding to the tax changes, that is precisely the substitution the policy was designed to produce, and it is showing up. The honest reading is that the Budget is visibly shifting the composition of investor activity while the overall retreat was driven by something that started earlier. Something, say, like 75 bps of tightening?
National prices are 3.3% below their March peak and annual growth has now slowed to 0.1%, which is to say nothing. That is a real change from last month, when we could still point to prices being 1.8% higher than a year earlier. The capitals are 1.6% lower over the year, with Sydney down 5.0% and Melbourne down 5.2%. Units continue to outperform houses, and the gap has if anything widened. National house prices are 0.4% lower over the year while units are 1.8% higher; houses are 3.6% below peak against 2.2% for units. This remains awkward for the tax case proponents, because units are the more investor-exposed segment and should be leading the falls if an investor tax shock were doing the work.
On revisions
Last month we reported August as a fall of 0.2% and called it the mildest of five. It now reads as a fall of 0.4%. The claim survives, but it was overstated, and July has been revised from -0.6% to -0.7%.
The pattern is consistent across three months of PropTrack releases now: the two most recent months get revised down hardest, the older months barely move. For anyone tracking this series, treat the latest two prints as provisional and do not build an argument on the most recent month alone.
In conclusion
Our contention was never that the Budget changes do nothing. It was that they could not explain most of a downturn that began before they were announced. Three months on, that looks more defensible rather than less. The decline started in April, peaked in intensity in June, has been easing ever since, and sits alongside four rate rises taking the cash rate to a 15-year high with the RBA making clear there could be more to come.
Queensland is not riding this out; Brisbane is now underperforming the national market and we said the opposite twice. Regional Australia broadly, including regional Queensland, genuinely is holding up, and that distinction matters more than we allowed for.
The next two months should settle a good deal of this. A fourth rate rise has just landed and is not yet in any of these numbers. How prices respond to this most recent hike, and to any further sense of where the RBA might be wanting rates to go into 2027, will tell us a great deal about how this property price cycle might be expected to develop.
 We are proud to have CBC Staff Selection as supporters of the Conus/CBC Staff Selection Trend Employment and Jobseeker data series