- Telephone
- Email

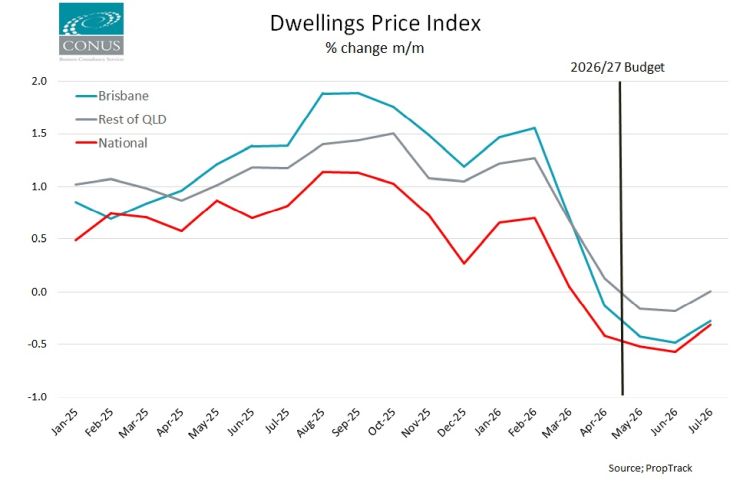
National dwelling prices are now 1.8% below their March 2026 peak, and July marked the fourth consecutive monthly fall on the PropTrack index. The convenient story is that this is the negative gearing and capital gains tax changes announced on Budget night doing their work. It is a tidy narrative, and the timing looks about right if you squint. But the data does not really support it, and the parts of the data that are interesting have almost nothing to do with tax.
The turn started before Budget night
Jim Chalmers handed down the 2026-27 Budget on 12 May. The PropTrack national index peaked in March, and the first negative month was April.
Here is the monthly sequence for national dwellings:
|
Month |
Change |
|
February 2026 |
+0.70% |
|
March 2026 |
+0.05% |
|
April 2026 |
-0.42% |
| May 2026 |
-0.52% |
| June 2026 |
-0.57% |
| July 2026 |
-0.32% |
The entire deceleration, from a monthly pace of over 1% in late 2025 to zero by March, happened before anyone saw the Budget papers. And notice what the post-Budget months look like. The rate of decline steadies through May and June, then July is the smallest monthly fall in four months. If the tax changes were the driver, you would expect the effect to build, not fade. There is no step change in the series at May.
There is also a much more conventional explanation sitting right there. The RBA raised the cash rate at three consecutive meetings this year, in February, March and again on 5 May, taking it from 3.60% to 4.35% and fully reversing the easing delivered through 2025. The May hike took effect on 6 May, six days before Budget night. Add headline inflation running at 4.6% over the year to March on the back of the Middle East oil shock, and you have 75 bps of tightening plus a real income squeeze landing across exactly the months when housing momentum collapsed.
In their current commentary both property price index providers put rates first and the Budget second. PropTrack attributes the recent falls to three rate rises compressing borrowing capacity, compounded by cost-of-living pressures, and then names Budget tax changes as a further drag on buyer confidence. Cotality’s June report goes further, arguing that the negative gearing and CGT changes, on top of an accumulation of earlier investor disincentives, are likely to drive a material pullback in investor activity. The main thrust in this post is not controversial. Where we part company with them is on degree, and timing: they are forecasting an effect that has not yet shown up in the data, whereas the argument we are making is about what the numbers to July can actually demonstrate. Too often a forecast repeated often enough starts getting cited as an observation.
The policy design argues the same way
Look at what was actually legislated rather than what the headlines said.
Negative gearing on established residential property is limited from 1 July 2027, and only for properties contracted after 12 May 2026. Everything held at that moment is grandfathered indefinitely. New builds are exempt entirely. Investors caught by the change can still offset losses against residential rental income and against capital gains on rental property and can carry forward what they cannot use.
The CGT change is similar in shape. The 50% discount is replaced by cost base indexation plus a minimum 30% tax rate on gains, and it applies only to gains accruing from 1 July 2027. Not to gains already banked.
Whatever you think of the policy, and there is a serious argument on both sides, it does not deliver a cash flow shock to anyone in May 2026. The transmission channel at work is expectations: what the marginal investor is now prepared to pay for established stock, given a worse after-tax return from mid-2027. That is a real effect, but it is a gradual repricing at the margin, not a switch suddenly being thrown.
The dispersion is the actual story
Averages are doing a lot of concealing here. The national index is back to where it sat in October 2025. But look at how far each market has actually retraced. All figures below are dwellings, measured from each market’s own peak rather than a common date:
|
Market |
Peak | Off peak | Back to | Months rewound |
|
Melbourne |
Oct 2025 | -4.4% | Jan 2025 | 18 |
|
Sydney |
Nov 2025 | -4.0% | Apr 2025 | 15 |
| Capital cities | Feb 2026 | -2.5% | Sep 2025 |
10 |
| National | Mar 2026 | -1.8% | Oct 2025 |
9 |
| Brisbane | Mar 2026 | -1.3% | Jan 2026 |
6 |
| Rest of Qld | Apr 2026 | -0.3% | Feb 2026 |
5 |
The range runs from five months of lost ground in regional Queensland to eighteen in Melbourne, where the house-only series is worse still at -5.3% and back to December 2024. Calling this a ‘national correction’ flattens something that is not remotely uniform.
One caveat on that last column, because it cuts against our own argument if left unqualified. The months-rewound figure is sensitive to how fast a market was climbing before it turned, not just to how far it has fallen. Regional Queensland is only 0.3% below its April peak, yet that erases five months on the clock because growth had already flattened to 0.7% in March and 0.1% in April. Brisbane is four times further off its peak but rewinds only six months of gains, because it was still climbing at 1.5% a month into February. In practice regional Queensland has been flat since March rather than falling, and the rewind column makes that look more like a retreat than it is.
It also complicates the Budget story further. Sydney and Melbourne peaked in November and October 2025 respectively, six and seven months before Budget night. Those two markets have been falling for the better part of a year, and they are dragging the national aggregate down with them. You cannot attribute to a May 2026 Budget a decline that began in spring 2025.
The counter-argument
There is a counter-argument here, and it is the strongest version of the ‘it’s all the Budget’ case, so it deserves an airing. Negative gearing is worth most where rental yields are lowest, because that is where net rental losses are largest and the ability to deduct them against income matters most. Sydney is the lowest-yielding capital in the country on Cotality’s figures, at 3.1% gross for dwellings, and it has fallen furthest of the capitals bar Melbourne. On that logic a shock to negative gearing should hit the low-yielding markets hardest and leave the higher-yielding ones comparatively unscathed.
However, the yield numbers are precisely where the argument comes unstuck. Brisbane is the second-lowest-yielding capital in Australia at 3.3%, below Melbourne at 3.7%. If the negative gearing channel were doing the work, Brisbane should be among the worst affected markets in the country. It is among the least affected, down 1.3% from its peak against Melbourne’s 4.4%, and still growing at 11.1% a year. Add the timing problem, and the fact that the segment most exposed to investor tax treatment is outperforming rather than underperforming, and the tax story has very little left to stand on.
Queensland has turned too, just more gently
The ‘Queensland is doing better’ story holds up, but it needs stating carefully. Brisbane first fell in April, Rest of Queensland in May.
What is different in Queensland is the pace and the starting point. Brisbane is running at +11.1% over the year and Rest of Queensland at +9.8%, against a national figure of just 3.9%. Rest of Queensland is a rounding error below its April peak, was flat in July, and regional Queensland units actually set a new record high in July. Regional South Australia and Tasmania are also at record highs. Darwin was the only capital city to rise in July, and it too hit a new peak.
Units are beating houses, which also cuts against the tax story
Nationally, houses are up 3.6% over the year and units 5.1%. From their respective peaks, houses are off 2.1% and units just 1.0%. Regional units in Queensland, South Australia, Tasmania and Victoria are all at or near record levels.
This matters because units are the more investor-exposed segment of the market. If a negative gearing and CGT shock were the dominant force, that is where you would expect the damage to concentrate, but it hasn’t.
That looks like a borrowing capacity story, rather than a tax story. Rate rises cut what buyers can borrow, buyers respond by trading down, and cheaper stock in cheaper markets holds its value while the expensive end gives ground. It is one of the more predictable patterns in Australian housing and it is exactly what we are watching.
A wrinkle worth knowing about
The PropTrack index we’ve used for this analysis is revisionary. The full history is recalculated every month and the most recent three years of values are revised. That has a consequence for how this narrative formed.
|
Month |
As published at the time | Current vintage |
|
April 2026 |
-0.1% | -0.42% |
|
May 2026 |
-0.04% | -0.52% |
| June 2026 | -0.3% |
-0.57% |
| July 2026 | -0.3% |
-0.32% |
At the original time of publication, April and May looked flat. The market appeared to turn decisively only in June and July, comfortably after Budget night, which is precisely why the Budget got the blame. The revised data now shows prices were already falling meaningfully in April, before the Budget existed. The story that stuck with many was built on a vintage of the data that no longer exists.
The figures in this post are from the vintage published on 3 August 2026 and will themselves move.
So what?
The tax changes are plausibly contributing at the margin, and they will contribute more as 1 July 2027 approaches and the marginal investor actually has to price them. But on the evidence to date they are a supporting actor. Three rate rises, an oil-driven inflation shock and stretched affordability are doing the heavy lifting, and the cycle had already turned before the Treasurer stood up.
The thing to watch is not the annual growth rate, which is a lagging indicator that falls mechanically as negative months accumulate, and which currently makes the post-Budget period look far more decisive than it was. Watch the monthly prints, and watch whether regional Queensland’s flat July becomes a run of flat months or the start of something else. Also worth noting that Cotality are somewhat weaker on Queensland; their regional index turned negative in July for the first time since January 2023 and they already have Brisbane falling 0.6% versus just 0.3% for PropTrack. Regional Australia is the one segment where the two major indices currently disagree on direction, and that disagreement will resolve one way or the other over the next couple of months.
 We are proud to have CBC Staff Selection as supporters of the Conus/CBC Staff Selection Trend Employment and Jobseeker data series