- Telephone
- Email

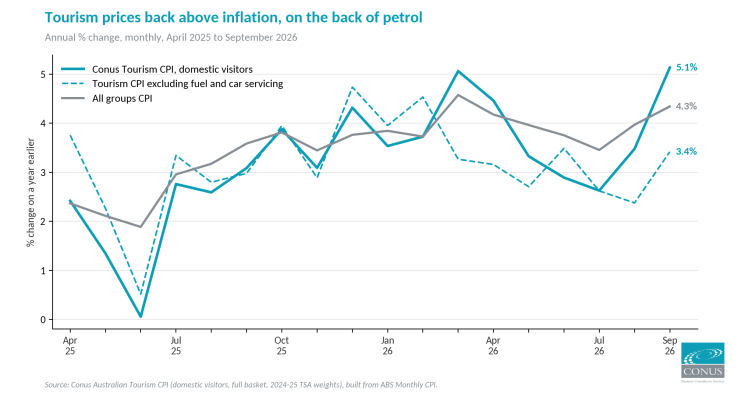
Our Conus Australian Tourism CPI, which we now run monthly off the ABS Monthly CPI, rose 5.1% in the year to September for domestic visitors, against 4.3% for the CPI. That 0.8 point gap is the widest since the monthly series begins in April 2025, and it is the first month tourism prices have run ahead of inflation since April. In August they were behind, 3.5% against 4.0%.
Before anyone reads that as hotels and airlines cashing in, look at what is driving it. Fuel and car servicing make up 13.6% of what domestic visitors spend, and the ABS has automotive fuel up 23.6% on a year ago. That one line adds 2.2 points to the 5.1%, more than the whole gap. Take it out and tourism prices rose 3.4%, below the CPI. The things you only buy because you are travelling (accommodation, flights, tours and the like) rose 4.4%, roughly in line with inflation. The ABS did report domestic holiday travel and accommodation up 8.0% in September alone, but that is the original series catching the school holidays; over the year it is up about 5%.
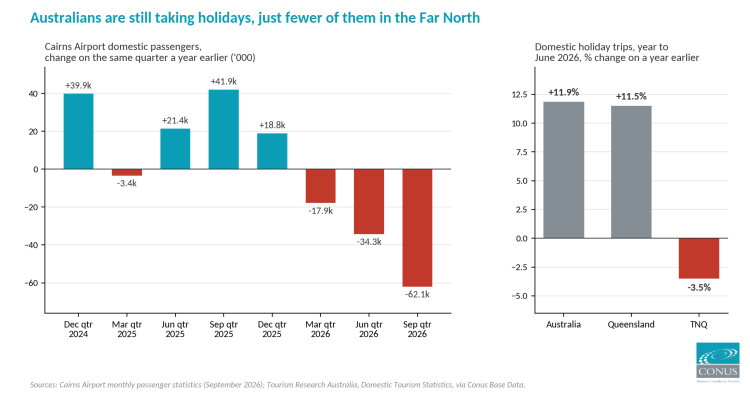
That matters for the Far North because petrol and airfares hit different visitors, and it is the fly-in market into Cairns that is now going backwards. Domestic passengers through Cairns Airport were down 5.3% in the September quarter on a year earlier, the third quarterly fall in a row and each bigger than the last. This is not Australians giving up on holidays: in the year to June, national holiday trips rose 11.9% and Queensland’s 11.5%, while Tropical North Queensland’s fell 3.5%. Budgets are tighter (national overnight tourism spend was flat, a real fall of about 3% on our index), and the pattern fits people choosing cheaper, closer trips rather than staying home. Fewer seats are part of it too: domestic seat capacity into Cairns was 4.1% lower over the two years to June, with planes running 83% full.
In August we wrote that the post-COVID squeeze on travel costs was easing, with the quarterly index running below the CPI. One month does not overturn that, and this month is largely a petrol story: if fuel eases, so will this. Operators who rely on the drive market are the ones who should be watching the bowser. As always, this is a constructed index on original, not seasonally adjusted, data, so read the year-on-year change rather than the monthly movement.
 We are proud to have CBC Staff Selection as supporters of the Conus/CBC Staff Selection Trend Employment and Jobseeker data series