- Telephone
- Email

The ABS puts a price on almost everything. There is a CPI series for bread, for childcare, for vets services, for beer. There is no published price index for a holiday. Conus has now built one: a quarterly Australian Tourism CPI running back to September 1989. Its first finding is not the one most operators would expect. Since 1990 the cost of travelling in Australia has risen 123.7% against the CPI’s 148.3%. Over a generation, travel here has become cheaper in real terms, not dearer.
This matters because of what the industry currently uses instead. The numbers quoted in almost every tourism discussion are spend figures: dollars per visitor, dollars per night, total expenditure., but those are not prices. If spend per trip is flat, that might mean prices were flat, or it might mean visitors met higher prices by buying less. Nothing in a spend series lets you tell the two apart, and the difference is the whole question when the argument is about whether a destination has become too expensive. That argument is a permanent fixture in Cairns and across Tropical North Queensland, and until now it has been conducted almost entirely on evidence that cannot settle one from the other.
The construction of the index is not complicated. The ABS Tourism Satellite Account records what visitors actually spend money on, product by product: accommodation, restaurant meals, long-distance transport, car hire, tours, recreation, shopping. Those shares become a fixed basket. Each item in the basket is then priced using the matching component of the quarterly ABS CPI, and the whole thing is added up and rebased so that calendar 2017 equals 100. Holding the basket fixed is the point: it means the index measures what happened to prices, rather than what happened to prices mixed together with changes in what visitors chose to buy. We hold ours at the 2024-25 basket, the most recent the ABS publishes.
One judgement call we had to make is worth noting, because it is significant. The Tourism Satellite Account counts international student fees as tourism consumption, and at 2024-25 that is 17.9% of the international visitor basket. We have excluded it from the Conus Tourism CPI. If you leave it in then growth in the international series since 1990 shifts from 121.1% to 148.8%, which tells you a great deal about university fees and very little about what a visitor pays on a trip.
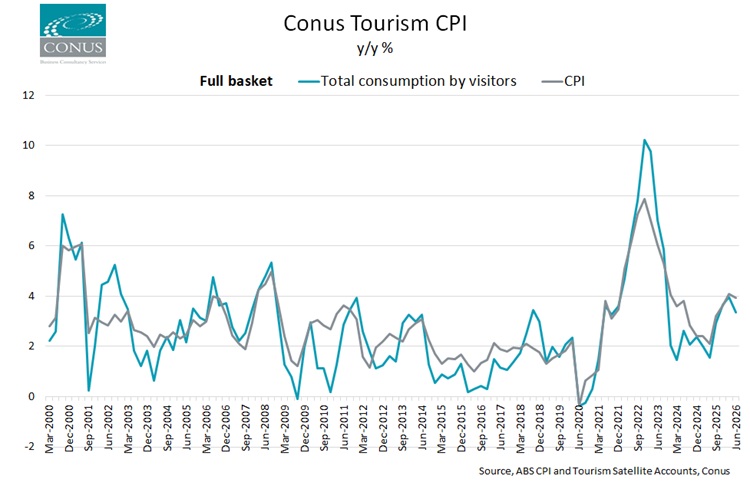
The first result is, frankly, a little deflating. The three headline series (Domestic, International and All Visitors) barely differ from one another, or from headline inflation. Between 2019 and 2025, international visitor prices rose 22.2%, domestic 23.6%, and all visitors combined 23.3%, against a CPI increase of 23.9%. There is a structural reason why. A full tourism basket is 17% restaurant meals, 12% groceries and alcohol, 14% fuel and car servicing, and 10% clothing. Most of what a visitor buys is what everybody buys, so a broad tourism basket converges on a broad consumer basket almost by construction.
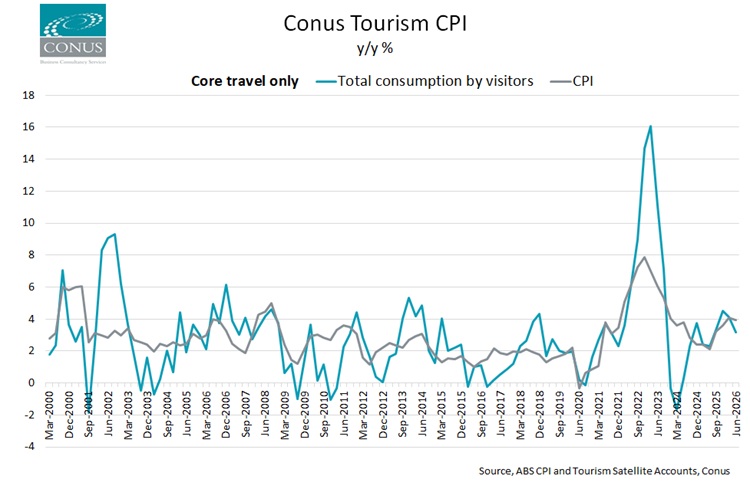
Strip it back to the things you pay for because you are travelling, and the picture changes completely. Accommodation, holiday-home rent, long-distance transport, travel agency services, and recreation make up 42% of the domestic basket. That core rose 27.3% between 2019 and 2025, against the CPI’s 23.9%. In the March 2023 quarter it was running at 16.4% year on year while headline CPI was 7.0%, the widest gap anywhere in the series. Then it reversed: down 0.6% over the year to December 2023 and down 2.0% to March 2024, while the CPI was still rising above 3.5%.
Put the long run and the short run together and the story is clear enough. Core travel costs sat 5.6 index points above the CPI in 1990 and converged steadily for nearly 30 years, reaching parity in 2017. The post-COVID border reopening then blew that gap out to 8.4 points by 2023, undoing roughly a decade of relative cheapening in about two years. Some of it has since been handed back to 6.2 points in 2025, and the most recent quarter has tourism prices rising more slowly than the CPI again, at 3.4% against 3.9%. The squeeze visitors complained about through 2022 and 2023 was real, it was concentrated in flights and beds rather than in the general cost of being here, and it is now easing.
There are caveats, because this is a constructed index and not an official one, and they are worth being upfront about. There is no standalone accommodation index in the Australian CPI, so lodging is priced using the ABS domestic holiday travel and accommodation series, which bundles airfares in with rooms. Shopping is priced using clothing and footwear, which is narrower than the category it stands in for. Around 31% of the basket is priced off two closely related ABS travel series, so the index is more sensitive to those than the weights alone suggest. None of that undermines the direction of travel, but anyone quoting a figure to the second decimal place is probably kidding themselves about accuracy!
The index is built entirely from published ABS data and updates each quarter as the CPI lands, with the basket refreshed each December when the Tourism Satellite Account is released. We will report it here as it moves. If tourism prices are going to be argued about in Far North Queensland, and they will be, the argument may as well be had against a price series rather than a spend one.
Index constructed by Conus Business Consultancy Services. For further details or full data set please contact us.
 We are proud to have CBC Staff Selection as supporters of the Conus/CBC Staff Selection Trend Employment and Jobseeker data series