- Telephone
- Email

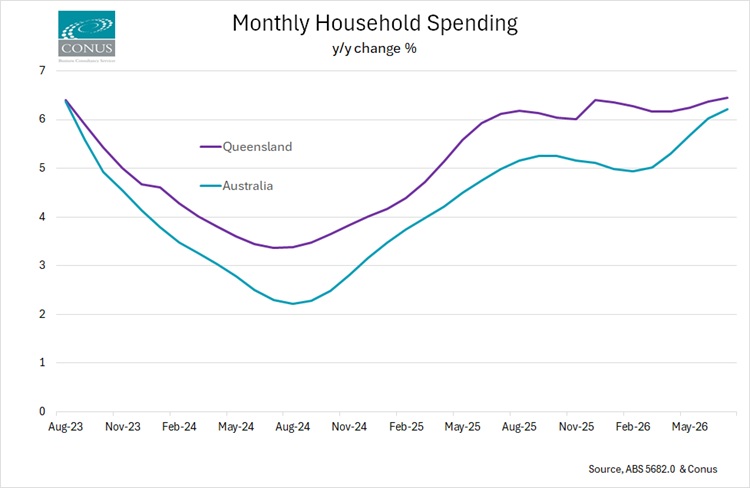
Queensland household spending was 6.5% higher than a year earlier in July, against 6.2% for Australia, on the ABS Trend series. Queensland is ahead, but by 0.23 percentage points, which is a good deal less than the headline number suggests. Both figures are in current prices, so they mix up how much households bought with what they paid for it, and July was not a quiet month for prices.
The quarterly chain volume data strips the prices out, and it is the honest test. In the June quarter Queensland household spending rose 2.8% in real terms against 2.4% nationally. So the real lead survives deflation, at 0.34 points. But note what happens to the level: national spending growth falls from 6.2% nominal to 2.4% real, and Queensland’s from 6.5% to 2.8%. On both measures roughly three-fifths of the spending growth is prices rather than extra goods and services. The two series differ in period and construction, so treat that as an order of magnitude, not an actual deflator.
The more important number is how fast the gap is closing. In the March quarter Queensland’s real lead over the nation was 1.7 points. In the June quarter it is just 0.3. Queensland has now outgrown the national average in real terms in seven of the last eight quarters, and its share of national household spending has climbed from 20.4% to 20.8% over two years, so the run is real. It is also, on this quarter’s evidence, very nearly over.
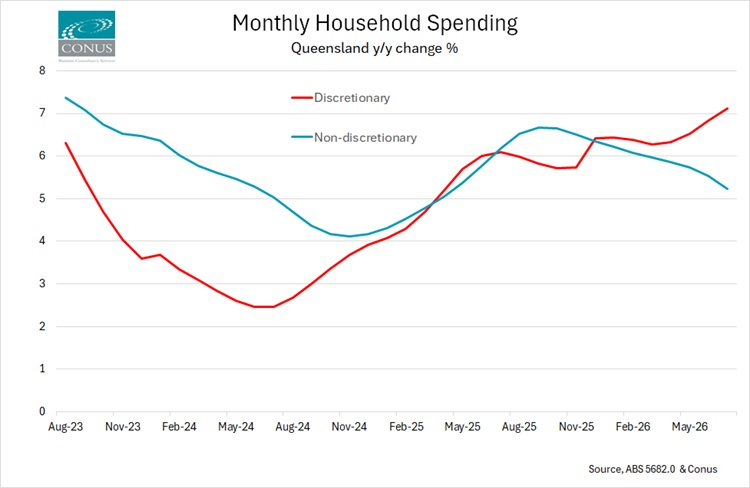
The discretionary split is mildly encouraging but should not be oversold. Queensland is ahead of the nation on both halves: discretionary spending up 7.1% against 6.8%, non-discretionary up 5.2% against 5.1%. This is not a story about Queenslanders splashing out while the rest of the country pays bills. What can be said is that Queensland’s lead is wider on the discretionary side, and discretionary spending is the part households tend to stop first when they are under pressure. Two years ago Queensland’s discretionary share sat below the national share, at 64.5% against 64.7%. It is now marginally above, 64.9% against 64.8%. This is a crossover worth watching rather than a decisive break.
The goods and services split cuts the other way, and it is the sharper divergence of the two. Queensland is 1.0 point ahead of the nation on goods and 0.7 points behind on services. Services is where most of the experience-type discretionary spending sits, and it is the half you would expect a genuinely confident household sector to be leading on. Queensland is not.
The obvious objection is that Queensland simply has more people in it each year. It does, but not by enough to explain this. Queensland’s population grew 1.6% in the year to December 2025 against 1.5% nationally, a lead of only about 0.14 points, well short of the 0.34 point real spending lead. Per head, Queensland households are still spending more in real terms than the national average, by something like 0.2 points. That is a thin margin, and the population data runs to December ’25 while the spending data runs to June ’26, so read it as a sense check rather than a measurement.
What it adds up to is a Queensland household sector that is modestly stronger than the national one, genuinely rather than just nominally, and losing that advantage quickly. The composition is the part that we need to treat carefully: the lead is concentrated in goods rather than services, which is more consistent with household formation than with confidence. Queensland gained 16,528 people from other states over the year while New South Wales lost 21,465, and people who move interstate generally buy furniture, whitegoods and cars. That is a hypothesis this data cannot test, but it fits the shape of the numbers better than a story about Queenslanders feeling particularly flush.
There is one caveat to bear in mind. The ABS Household Spending Indicator covers nine of the thirteen spending divisions and excludes housing, utilities, communication and education, all of them heavily non-discretionary, which is why discretionary spending looks like 65% of the measure when it is nothing like 65% of a household budget. The shares above are shares of the indicator, not of what people actually spend.
 We are proud to have CBC Staff Selection as supporters of the Conus/CBC Staff Selection Trend Employment and Jobseeker data series