- Telephone
- Email
The ABS have just released population data to the end of 2025. This post takes a look at Queensland’s population growth over the past four decades. The data tells a clear structural story, and the interesting part is in the composition rather than the headline. Averaged by financial year, the three drivers have traded places:
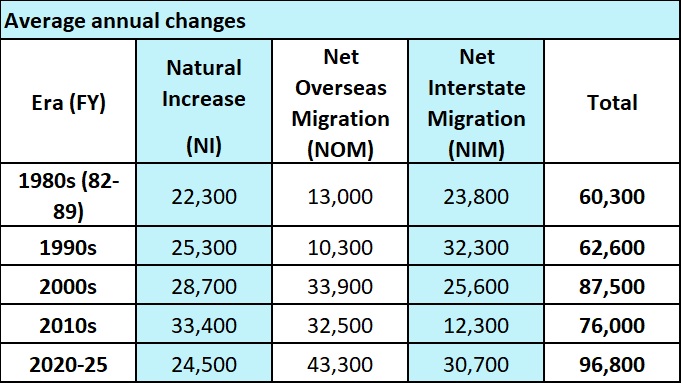
In the 1980s and 1990s, Queensland was the country’s interstate-migration story. NIM was the single largest driver, averaging around 24,000 then 32,000 a year, and it peaked at roughly 50,000 in the year to September 1993, the largest annual NIM figure anywhere in the series. This is the classic “sunbelt drift”: southerners moving north for climate, affordability and lifestyle. Overseas migration was a comparatively minor contributor through this period (around 10,000 to 13,000 a year).
The 2000s rebalanced the model. As the national migration program expanded, NOM surged to average roughly 34,000 a year and overtook NIM as the leading driver. Growth was strong on all three fronts and total growth stepped up to an average near 87,000 a year, well above the prior decades.
The 2010s are where the distinctive Queensland feature, interstate migration, briefly broke down. NIM collapsed to an average of about 12,000 a year and bottomed at roughly 5,400 in the year to December 2010, as the mining downturn and a narrowing housing-cost gap with the southern states removed much of the pull. NOM stayed high, and natural increase reached its structural peak (averaging around 33,000 a year, topping out near 36,800 in the year to September 2009). Growth eased to an average of about 76,000 a year.
COVID: the components moved in opposite directions
The pandemic produced the most violent swings in the series, and they pulled in opposite directions, which is the part worth dwelling on. With borders closed, NOM went negative, reaching an annual trough of roughly -15,000 in the year to March 2021. At the same time, NIM surged as Queensland became the prime destination for Australians leaving locked-down Sydney and Melbourne: FY2021 NIM was around 40,000, a level not seen since the mid-1990s. The two largely offset, and total growth in FY2021 (about 50,000) actually held up better than the collapse in overseas migration alone would suggest.
The rebound was then extraordinary. NOM exploded as borders reopened, hitting an all-time annual peak near 90,000 in the year to September 2023, and total population growth reached a record of roughly 143,700 over that same year. FY2023 total growth of about 139,000 was more than double the long-run norm.
Where it sits now, and what’s driving it
The most recent picture is one of moderation from an exceptional peak, not a return to weakness. Annual growth to December 2025 was around 92,000, down roughly a third from the 2023 record but still comfortably above the pre-pandemic decade’s average. The composition has shifted decisively: of that latest annual growth, NOM accounts for around 59%, natural increase about 23%, and NIM about 18%.
Three component-level points stand out:
Natural increase is in slow structural decline. It has fallen from its late-2000s peak (around 36,800) to about 21,000 and is still easing, reflecting fewer births and an ageing population. The ABS data shows Queensland births in 2025 were 33% lower than ten years earlier and 28% below the recent 2021–22 peak. It is now usually the smallest of the three contributors.
NOM is now both the dominant driver and the most volatile and policy-sensitive one (visa settings, student flows, border policy). It is moderating but has remained higher than Queensland’s pre-COVID level and continues to run above pre-pandemic quarterly rates.
NIM remains Queensland’s genuine point of difference. The state is still the country’s interstate-migration capital: its 2025 net interstate gain of around 16,500 was well above the next-highest state, Western Australia, at roughly 10,400. It is highly cyclical, tracking the housing-affordability gap with the southern states, but almost always positive.
The cumulative effect is a steadily rising national share: Queensland held 20.5% of Australia’s population at Dec 2025, up from 19.4% twenty years earlier and 18.4% at 2000, and grew by about 528,000 people, or 10.2%, over the five years to Dec 2025.
 We are proud to have CBC Staff Selection as supporters of the Conus/CBC Staff Selection Trend Employment and Jobseeker data series