- Telephone
- Email
Yesterday’s release of April building approvals numbers were disappointing for the market with a 5% decline for the month, translating into a 1.9 rise over the course of the year (seasonally adjusted). However, with highly volatile units approvals impacting these numbers, we prefer the Trend series which showed a 0.1% drop for the month and a 5.9% increase over the year. As the chart below makes clear, residential approvals have been flat-lining across the nation for the past 6 months.
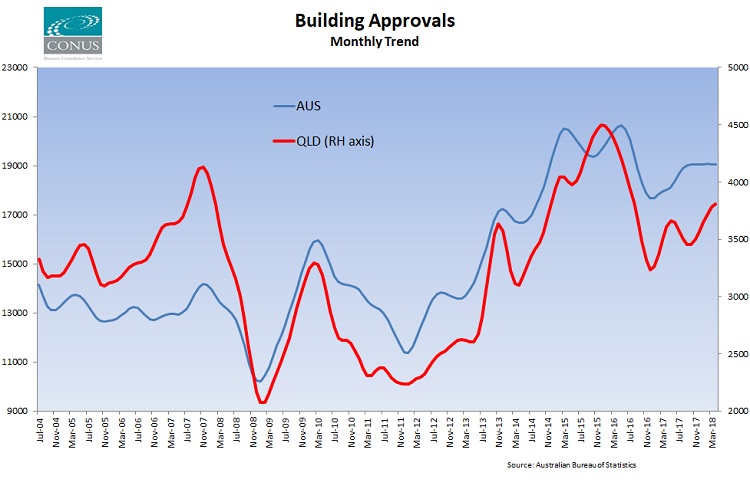
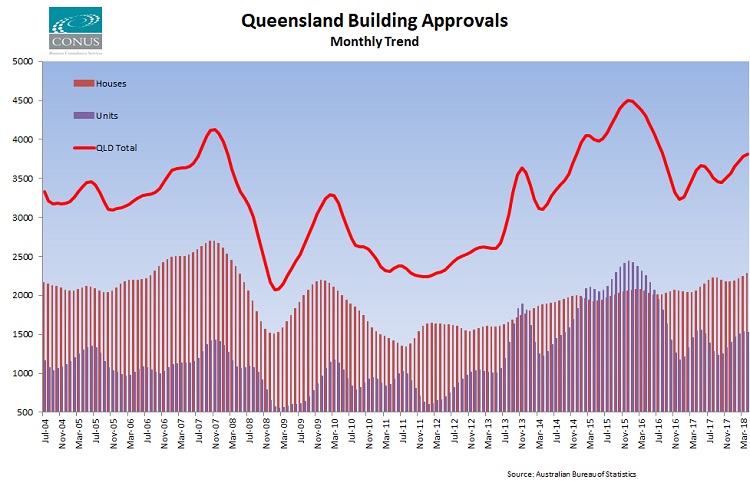
The story for QLD was rather better with the Trend showing a 0.7% increase for the month and an increase of 5.6% for the year. With the 2015-16 boom in unit approvals now well and truly behind us the increases are being driven by housing approvals which are up 10.8% for the year while units have fallen 1.4%.
Next week will see the release of the regional approvals data at which point we will be releasing our Conus Regional Approvals Trend series for QLD SA4s and the Far North LGA areas.
 We are proud to have CBC Staff Selection as supporters of the Conus/CBC Staff Selection Trend Employment and Jobseeker data series