- Telephone
- Email
The Cairns Post is this morning running a story about an apparent ‘skyrocketing’ in crime within the Cairns Regional Council area. The paper (never one to shy away from dramatising the crime story) quotes extensively from data provided by the organisers of an upcoming crime forum in the city. Unfortunately, although not altogether surprisingly, when you look at the actual data (as per the Queensland Police) you get a radically different story.
For a start, the data quoted appears to be relying on just the January and February data when the data for March is also readily available. It then quotes some staggering increases such as a 380% surge in armed robbery cases. What is missing from this ‘analysis’ (apart from the fact that you can access the March data) is the fact that this component is miniscule when taken in context. As an example, in the first quarter of ’23 Cairns saw 13 armed robberies. That figure fell to just 7 in the same period in ’24 (where were the headlines of a 46% collapse in armed robberies?!) but has undoubtedly risen in ’25 to 35; a 169.2% increase. However, this needs to be seen against the backdrop of a total crime count in the first quarter of more than 8,000. Even if we consider just Offences against the Person (1,247 in Q1 ’25) armed robbery becomes a statistical insignificance.
It should go without saying that comparing one 3-month period (or even worse a 2-month period) in one year to another is fraught with statistical problems. Nevertheless, we can at least improve that analysis by looking at a 3-year trend for the respective first quarters; and doing so shows us a very different picture to the one being suggested.
The statement in the Cairns Post story that “There was a reported increase in all offences within the Cairns local government area.” is simply not true.
All the following is sourced directly from Queensland Police data for the first quarter of each respective year for the Cairns Regional Council area and are the changes from ’23 to ’25 and detail totals and a selection of specific crimes.
Total crimes; +3.3%
If you really want to address crime in Cairns it’s clear that the focus needs to be on possession of drugs, drunk driving and DV Orders rather than getting distracted by statistically insignificant headlines about rape, assault and armed robbery! This commentary is in no way suggesting that crimes such as rape, assault and armed robbery are not incredibly important and abhorrent, rather that focusing so much attention on these crimes takes focus away from where the real crime problem (such as it is) actual resides.
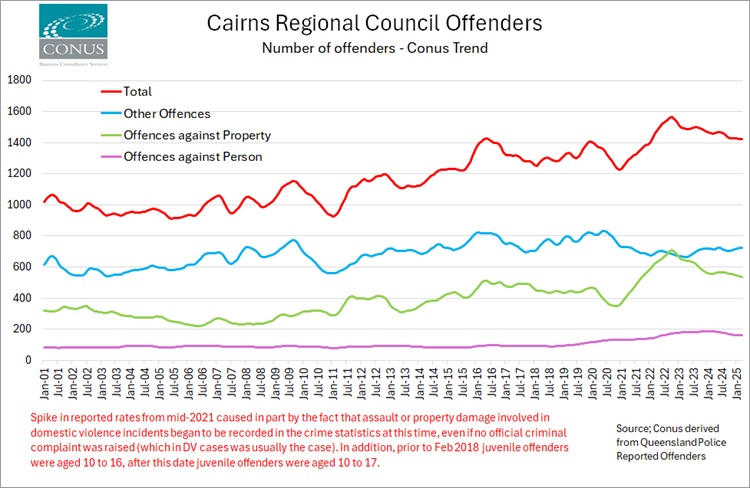
The chart provides a longer-term perspective on monthly data and clearly shows the decline in total crime since the end of 2022 being driven by a decline in Offences against Property, and a much less significant decline in Offences against the Person. Bear in mind that these figures are not adjusted for population growth; population in Cairns Regional Council area has grown by about 55% since 2001.
 We are proud to have CBC Staff Selection as supporters of the Conus/CBC Staff Selection Trend Employment and Jobseeker data series